Learn how to sketch and interpret derivative graphs, analyze function behavior, and solve calculus problems visually with guided examples.
Table Of Contents
📘 Graphing Functions Using Derivatives
Master the Art of Sketching Accurate Function Graphs with Derivatives
🎯 Why Use Derivatives to Sketch Graphs?
Plotting graphs just by plugging in values is time-consuming and often inaccurate. With derivatives, you can:
- Know where a graph goes up/down (increasing/decreasing)
- Locate local maxima or minima
- Identify points of inflection
- Analyze concavity
- Understand asymptotic behavior
This makes curve sketching faster, clearer, and more reliable.
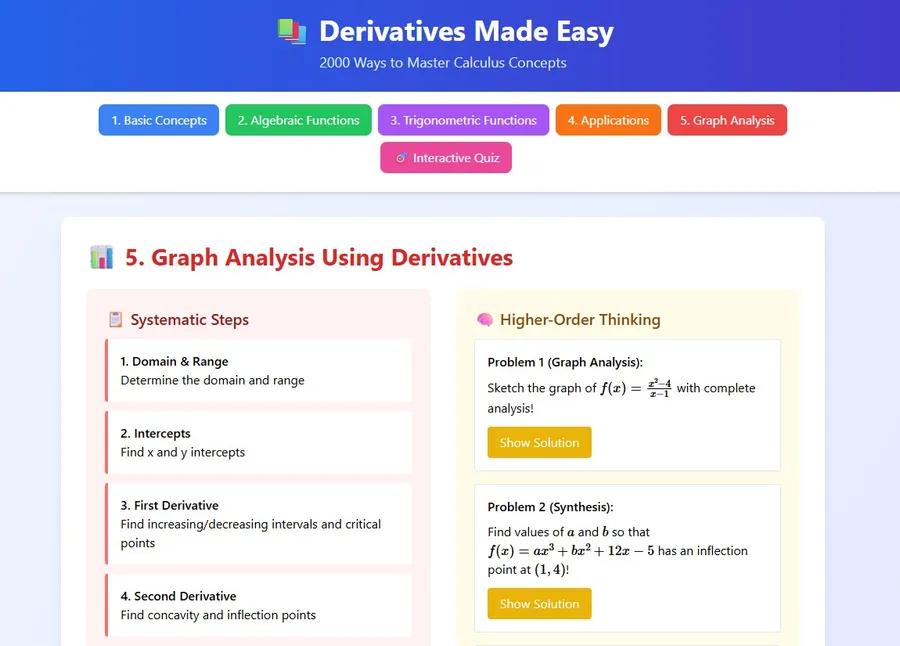
🪜 Step-by-Step Strategy for Sketching Functions
To sketch a function $f(x)$:
- Domain: Determine where $f(x)$ is defined
- Intercepts: Find $f(0)$ and where $f(x) = 0$
- Critical Points: Solve $f'(x) = 0$
- Increasing/Decreasing: Analyze sign of $f'(x)$
- Concavity: Use $f''(x)$ to determine concave up/down
- Inflection Points: Solve $f''(x) = 0$
- Asymptotes: Check vertical/horizontal/oblique behavior
- Sketch: Plot and connect behavior
🔍 Example 1: Graph $f(x) = x^3 - 3x$
Domain: All real numbers
Intercepts:
- $f(0) = 0$ → y-intercept
- Solve $f(x) = 0 \Rightarrow x(x^2 - 3) = 0 \Rightarrow x = 0, \pm \sqrt{3}$
First Derivative:
- $f'(x) = 3x^2 - 3 = 3(x^2 - 1) \Rightarrow x = \pm 1$ (critical points)
Sign of $f'(x)$:
- $x < -1$ → positive
- $-1 < x < 1$ → negative
- $x > 1$ → positive → So, increasing → decreasing → increasing → Max at $x = -1$, min at $x = 1$
Second Derivative:
- $f''(x) = 6x$
- $f''(0) = 0$ → possible inflection point
- Concave down when $x < 0$, up when $x > 0$
Inflection Point: $x = 0$
No Asymptotes
Sketch: Use all this data to create a smooth graph
✅ Final Shape: An “S” curve crossing the x-axis at three points, turning at x = ±1, inflecting at x = 0.
📉 Example 2: Sketch $f(x) = \frac{1}{x^2 + 1}$
Domain: All real numbers
Intercept: $f(0) = 1$
First Derivative:
$$ f'(x) = \frac{-2x}{(x^2 + 1)^2} $$
Set $f'(x) = 0 \Rightarrow x = 0$ → critical point
- $x < 0 \Rightarrow f'(x) > 0$
- $x > 0 \Rightarrow f'(x) < 0$ → Max at $x = 0$
Second Derivative:
$$ f''(x) = \frac{6x^2 - 2}{(x^2 + 1)^3} $$
Set $f''(x) = 0 \Rightarrow x = \pm \sqrt{\frac{1}{3}}$ → inflection points
Asymptotes:
- No vertical (denominator never zero)
- Horizontal as $x \to \infty$, $f(x) \to 0$
✅ Shape: Bell curve with max at (0,1), decreasing toward 0 on both sides, with inflection points at $x = \pm \sqrt{1/3}$
🧠 Tips for Students
- Critical points help find peaks and valleys
- Second derivative shows whether the curve opens up or down
- Always label key points before sketching
- Don’t forget asymptotes in rational functions
- Check endpoints if the domain is restricted
💡 HOTS Problem
Let $f(x) = \frac{x^3}{x^2 + 1}$
Sketch its graph using:
- First derivative for increasing/decreasing
- Second derivative for concavity
- Find intercepts and asymptotes
🧠 Solution Outline
- Intercept: $f(0) = 0$
- First Derivative: Use quotient rule
- Second Derivative: Analyze using sign
- Horizontal asymptote? As $x \to \infty$, $f(x) \sim x$ → no horizontal asymptote
- Sketch based on all features
🧪 Practice Problems
🔹 Standard
- Sketch $f(x) = x^4 - 4x^2$
- Sketch $f(x) = \ln(x)$
- Sketch $f(x) = e^{-x^2}$
🔥 HOTS
Sketch $f(x) = \frac{x^2 - 1}{x^2 + 1}$
Sketch a piecewise function:
$$ f(x) = \begin{cases} x^2 & \text{if } x < 1 \
2x - 1 & \text{if } x \geq 1 \end{cases} $$
📌 Summary Table
| Feature | How to Find |
|---|---|
| Critical points | Solve $f'(x) = 0$ |
| Increasing/Decreasing | Analyze sign of $f'(x)$ |
| Maxima/Minima | Use First or Second Derivative |
| Inflection points | Solve $f''(x) = 0$ |
| Concavity | $f''(x) > 0$: up, < 0: down |
| Asymptotes | Analyze limits or denominator |